 Macadam
 GraphHopper connects operations through a visual graph: combine numbers, points, curves, surfaces and supported CAD commands, then expose useful parameters and outputs. Change an input and the connected design updates.
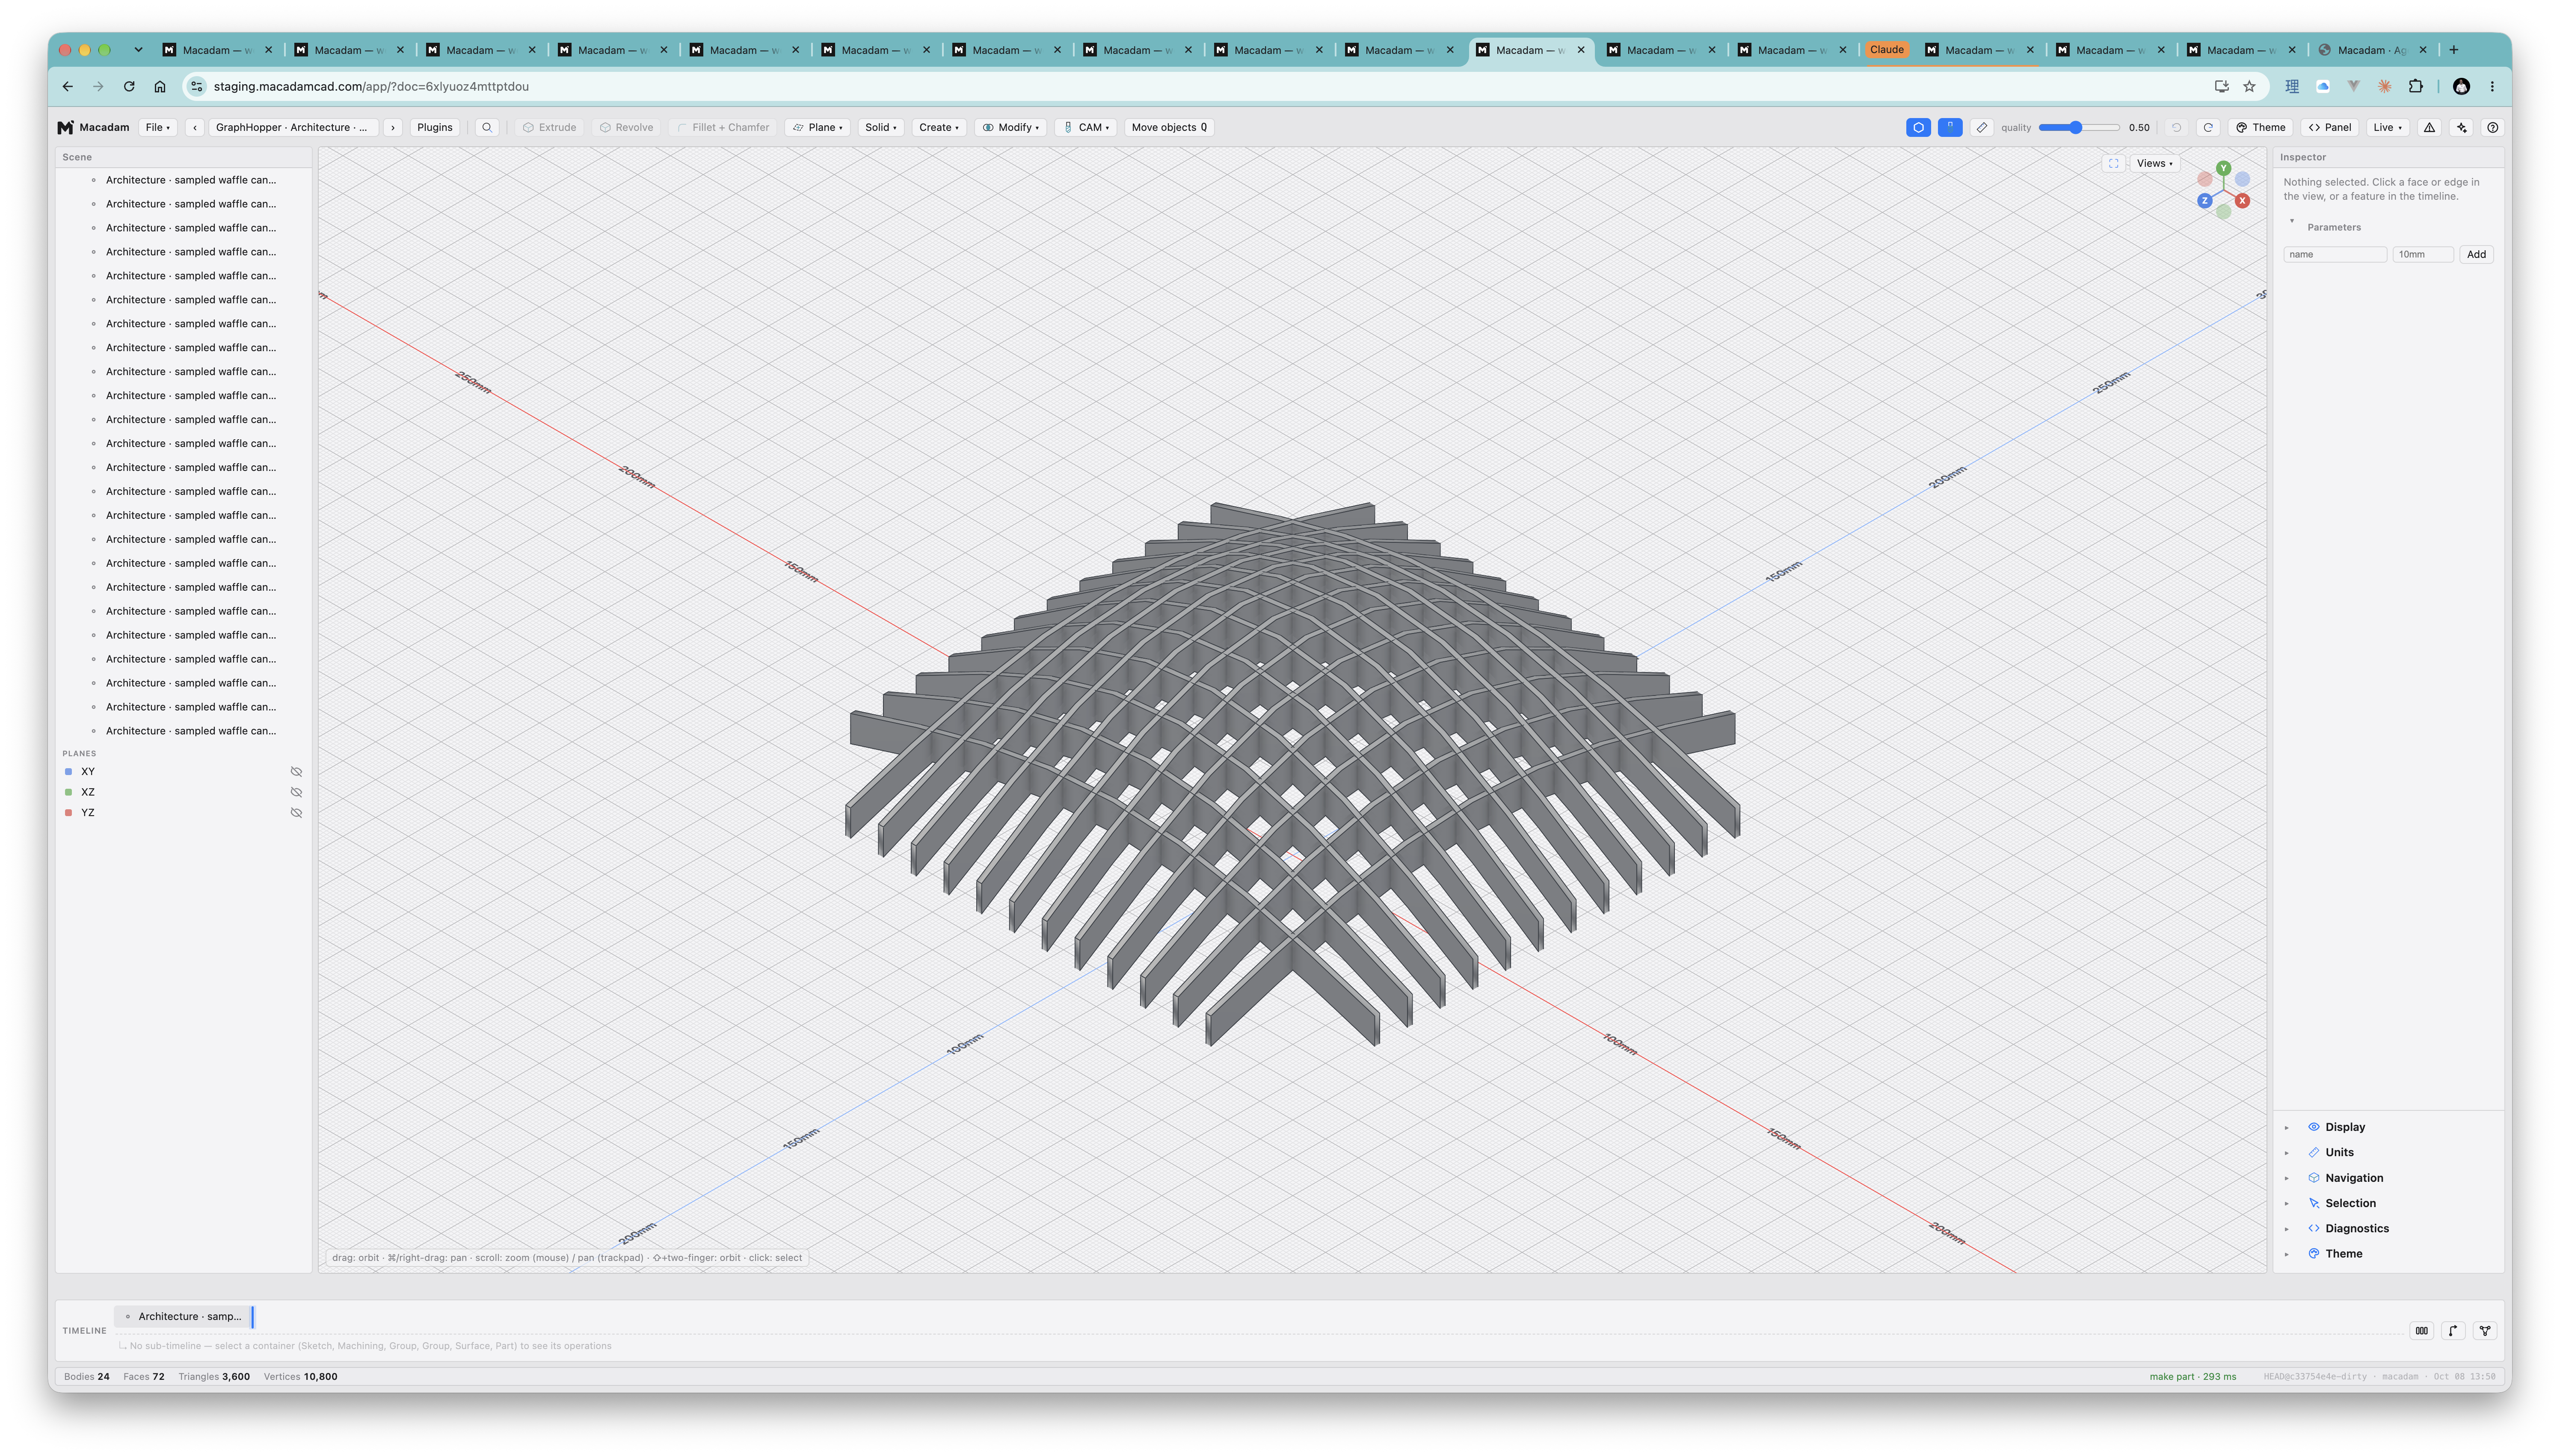
Start from architectural examples including a waffle canopy, a twisted tower and an attractor-driven facade. Use repeatable seeded random values, Perlin-style and value noise, or numeric CSV and JSON data to drive your geometry. Numeric inputs can be integers or decimals, with optional limits and scrub controls.
The editor supports multiple-node selection, folding and moving nodes together, and reconnecting links by dragging their plugs. Disconnected branches are ignored during computation. Graph errors appear in the shared Problems panel and status bar.
Template parts let you keep reusable graph definitions separate from their instances. Public graphs become commands in the enclosing document, while instances expose their inputs without opening the graph editor by default.
Explore the complete October preview for the rest of the update.